
Blog / Options
Calls and puts, explained: a beginner's guide to buying and selling options
What calls and puts actually are, who's on each side of the trade, where the money flows, and the four positions that make up every options strategy — written for someone who has never traded an option before.
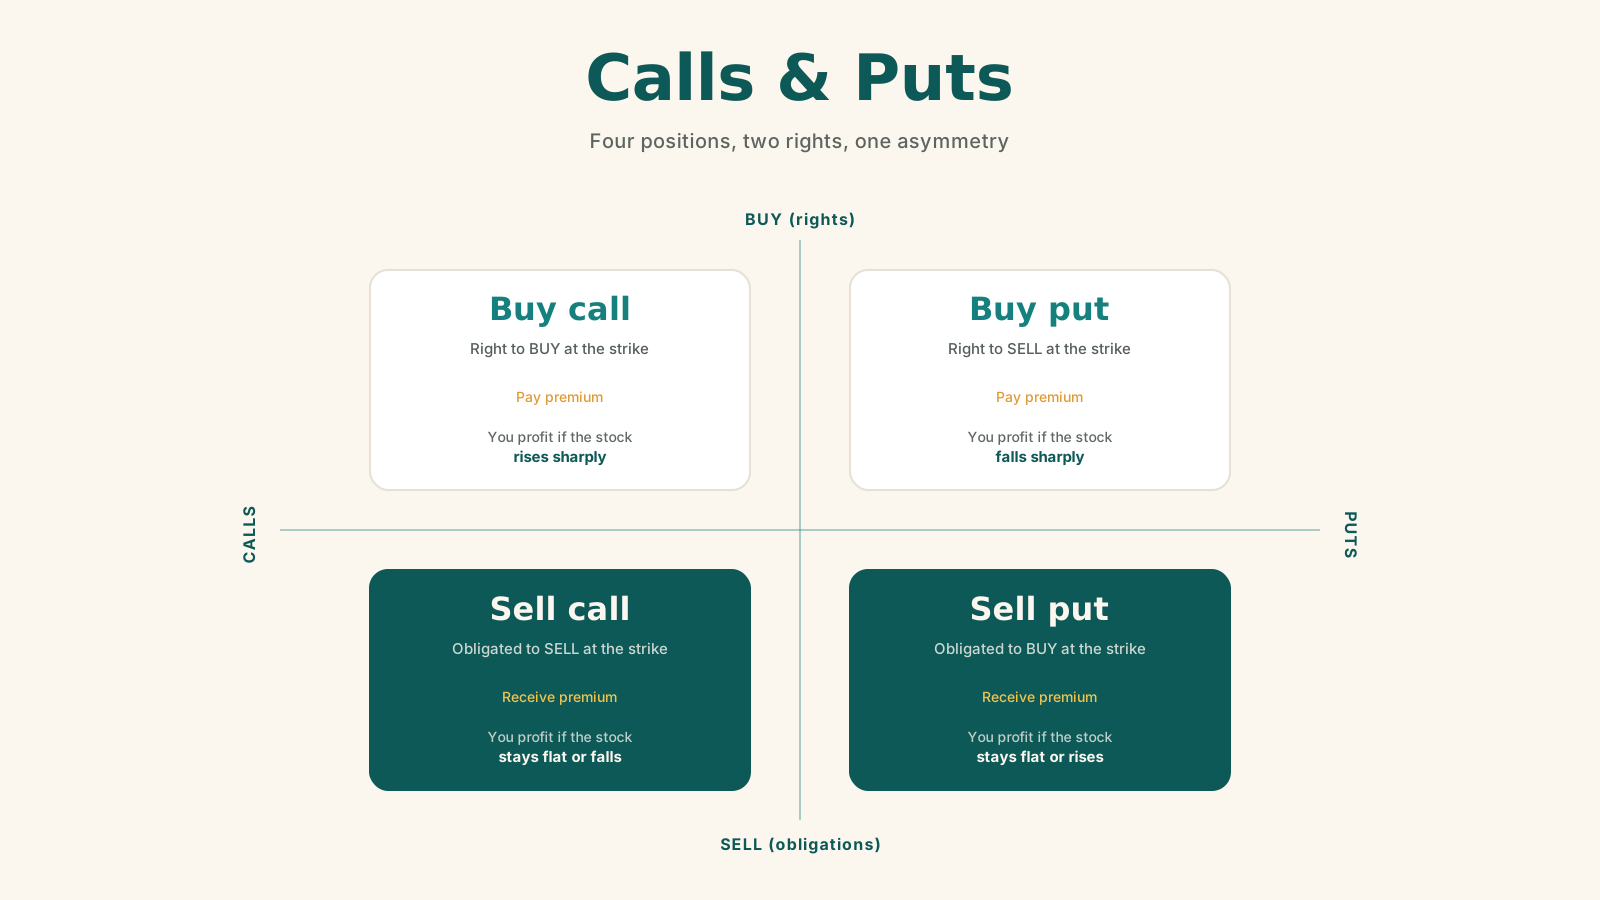
If you have ever read about "calls" and "puts" and felt like the explanation was written for someone who already understood, this post is for you. We are going to start from scratch — what an option is, who is on each side of the trade, where the money actually flows — and end with the four basic positions every options strategy is built from.
A note on what this is. This is education about how an instrument works, not financial advice and not a trading recommendation. Options can lose you more than you expect — selling options especially. Every loss number on this page is real, not polite. If you decide options are not for you after reading, that is a perfectly good outcome.
All examples below use $ and assume a contract covers 100 shares, so every per-share figure multiplies cleanly by 100 to get real money. In US markets a contract is always 100 shares; in Indian markets the lot size varies per stock (your broker will display it). The principles are identical — only the multiplier changes.
What an option actually is
An option is a financial contract between two people. One person — the buyer — pays cash up front for a right. The other person — the seller (also called the writer) — receives that cash and accepts an obligation to fulfil the right if asked.
That asymmetry is the entire game:
- The buyer has a choice. If using the right would hurt them, they walk away and the most they ever lose is the cash they paid.
- The seller does not have a choice. If the buyer wants to use the right, the seller must comply. In exchange the seller keeps the cash no matter what.
A useful mental model: the seller is an insurance company. They collect a premium up front and hope nothing happens. The buyer is the customer. They pay a small premium hoping for protection or profit if something does happen.
There are two contract types — calls and puts — and two sides — buyer and seller — giving four positions in total.
The vocabulary you need first
A handful of words show up on every options page. Learn these now and the rest of the article reads cleanly.
| Term | Plain meaning |
|---|---|
| Strike price | The agreed transaction price written into the contract. |
| Expiry date | The last date the contract is alive. After this it ceases to exist. |
| Premium | The price of the option itself — what the buyer pays and the seller receives. Quoted per share. |
| Contract / lot | One contract covers a fixed batch of shares (100 in US; varies by stock in India). All cash figures = per-share value × lot size. |
| Exercise | The buyer's action of using the right granted by the contract. |
| Assignment | What happens to the seller when the buyer exercises — the seller is now obligated to complete the transaction. |
| Expire worthless | If the right is not exercised by the expiry date, the option simply dies. The buyer loses the premium; the seller keeps it. |
The most common beginner mistake: treating the premium as the total cash. If the premium is $5 and the contract covers 100 shares, the cash actually changing hands is $5 × 100 = $500 per contract. Always multiply by lot size to get real money.
Calls vs. puts, at a glance
There are exactly two contract types:
- A call is a right to buy at the strike.
- A put is a right to sell at the strike.
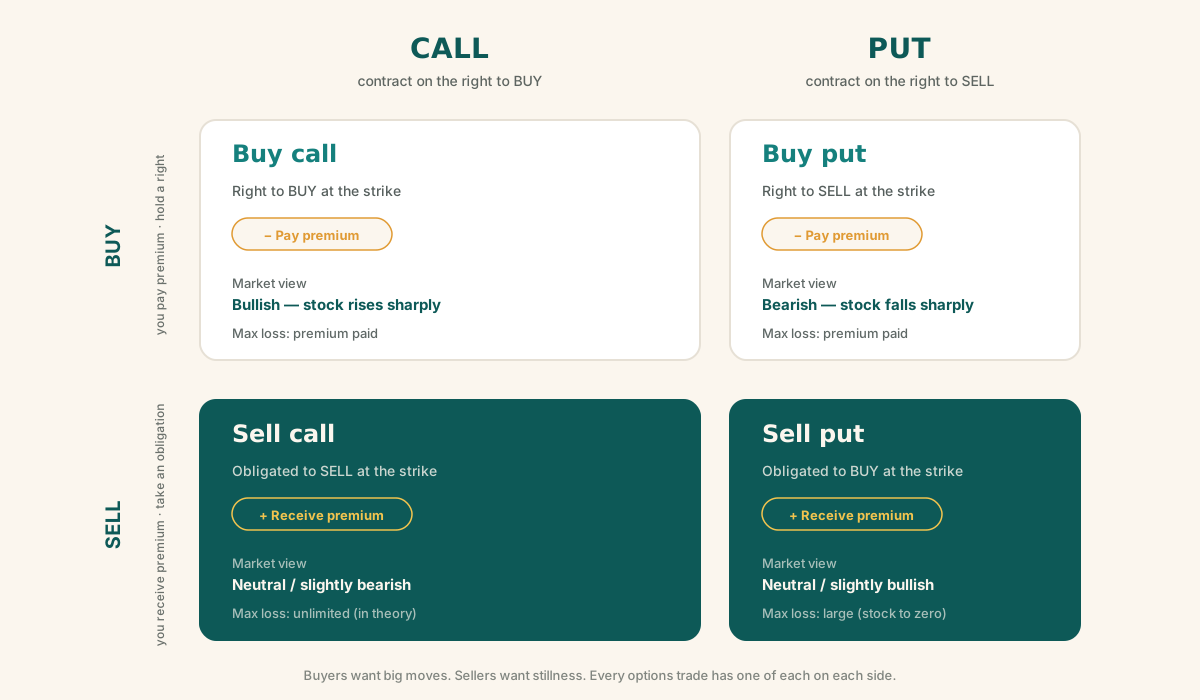
Combined with the two sides (buyer / seller), this gives four positions:
| Position | You... | Right / obligation | You profit when the stock... |
|---|---|---|---|
| Buy call | pay premium | right to buy at strike | rises a lot |
| Sell call | receive premium | obligation to sell at strike if assigned | stays flat or falls |
| Buy put | pay premium | right to sell at strike | falls a lot |
| Sell put | receive premium | obligation to buy at strike if assigned | stays flat or rises |
A reflex worth building immediately: buyers want big moves; sellers want stillness. Buyers paid for a chance at a big payoff; sellers got paid for the contract going quietly into the night.
Buying options
When you buy an option, you pay the premium up front. Your maximum loss is limited to the premium paid — nothing else can be taken from you. Your potential gain can be much larger.
Buy call — the right to BUY
Market view: bullish — you expect the stock to rise before expiration.
How it works
- You pay the premium.
- You now hold the right (not an obligation) to buy one lot at the strike price any time before expiry.
- If the stock rises above the strike, your right is worth real money. If it doesn't, your right expires worthless and you lose the premium.
The numbers (per share)
Profit if exercised at expiration  = (Spot − Strike) − Premium
Max loss    = Premium paid          (when Spot ≤ Strike at expiry)
Max profit  = Unlimited in theory   (Spot can keep rising)
To get dollars, multiply per-share values by 100.
Example. Stock at $100, you buy a $105 call for $3 premium.
- Cash paid today: $3 × 100 = $300.
- If stock closes at $115 at expiry: profit = (115 − 105 − 3) × 100 = +$700.
- If stock closes at $100 at expiry: option expires worthless, loss = −$300.
Buy put — the right to SELL
Market view: bearish — you expect the stock to fall before expiration.
How it works
- You pay the premium.
- You now hold the right to sell one lot at the strike price any time before expiry.
- If the stock falls below the strike, your right is worth real money. If it doesn't, your right expires worthless and you lose the premium.
The numbers (per share)
Profit if exercised at expiration  = (Strike − Spot) − Premium
Max loss    = Premium paid          (when Spot ≥ Strike at expiry)
Max profit  = Large                 (Spot would have to fall toward 0)
Example. Stock at $100, you buy a $95 put for $2 premium.
- Cash paid today: $200.
- If stock closes at $85: profit = (95 − 85 − 2) × 100 = +$800.
- If stock closes at $100: option expires worthless, loss = −$200.
Selling options
When you sell (write) an option, the buyer pays you the premium. You receive cash immediately. In exchange you accept an obligation — if the buyer exercises, you must transact at the strike, regardless of where the market is. Your maximum profit is the premium you received. Your potential loss is larger, sometimes much larger.
Sell call — the obligation to SELL
Market view: neutral to slightly bearish — you expect the stock to stay below the strike through expiry.
How it works
- You receive the premium.
- You accept an obligation: if the stock is above the strike at expiry (or the buyer exercises early), you must sell one lot at the strike.
- If the stock stays at or below the strike, the option expires worthless and you keep the full premium.
The numbers (per share)
Profit if expires OTM   = Premium received
Loss if assigned        = (Strike − Spot) + Premium   (negative when Spot well above Strike)
Max profit              = Premium received
Max loss                = Unlimited in theory          (Spot can keep rising)
Example. Stock at $100, you sell a $110 call for $5.
- Cash received today: $500.
- If stock closes at $105: call expires worthless. You keep +$500.
- If stock closes at $120: assigned. You must sell at $110 while the market is $120 → loss on shares $1,000, premium $500 → net −$500.
Sell put — the obligation to BUY
Market view: neutral to slightly bullish — you expect the stock to stay above the strike through expiry, and you'd be happy to own the stock at the strike if it dropped.
How it works
- You receive the premium.
- You accept an obligation: if the stock is below the strike at expiry (or the buyer exercises early), you must buy one lot at the strike.
- If the stock stays at or above the strike, the option expires worthless and you keep the full premium.
The numbers (per share)
Profit if expires OTM    = Premium received
Loss if assigned         = (Spot − Strike) + Premium   (negative when Spot well below Strike)
Max profit               = Premium received
Max loss                 = Large (stock can fall toward 0)
Example. Stock at $100, you sell a $90 put for $4.
- Cash received today: $400.
- If stock closes at $100: put expires worthless. You keep +$400.
- If stock closes at $80: assigned. You must buy at $90 while the market is $80 → loss on shares $1,000, premium $400 → net −$600.
Payoff diagrams — the picture is the point
A picture of profit and loss against the stock price at expiration tells you more in three seconds than a paragraph of text. The four diagrams below are the most useful single image in options trading. Memorize them.
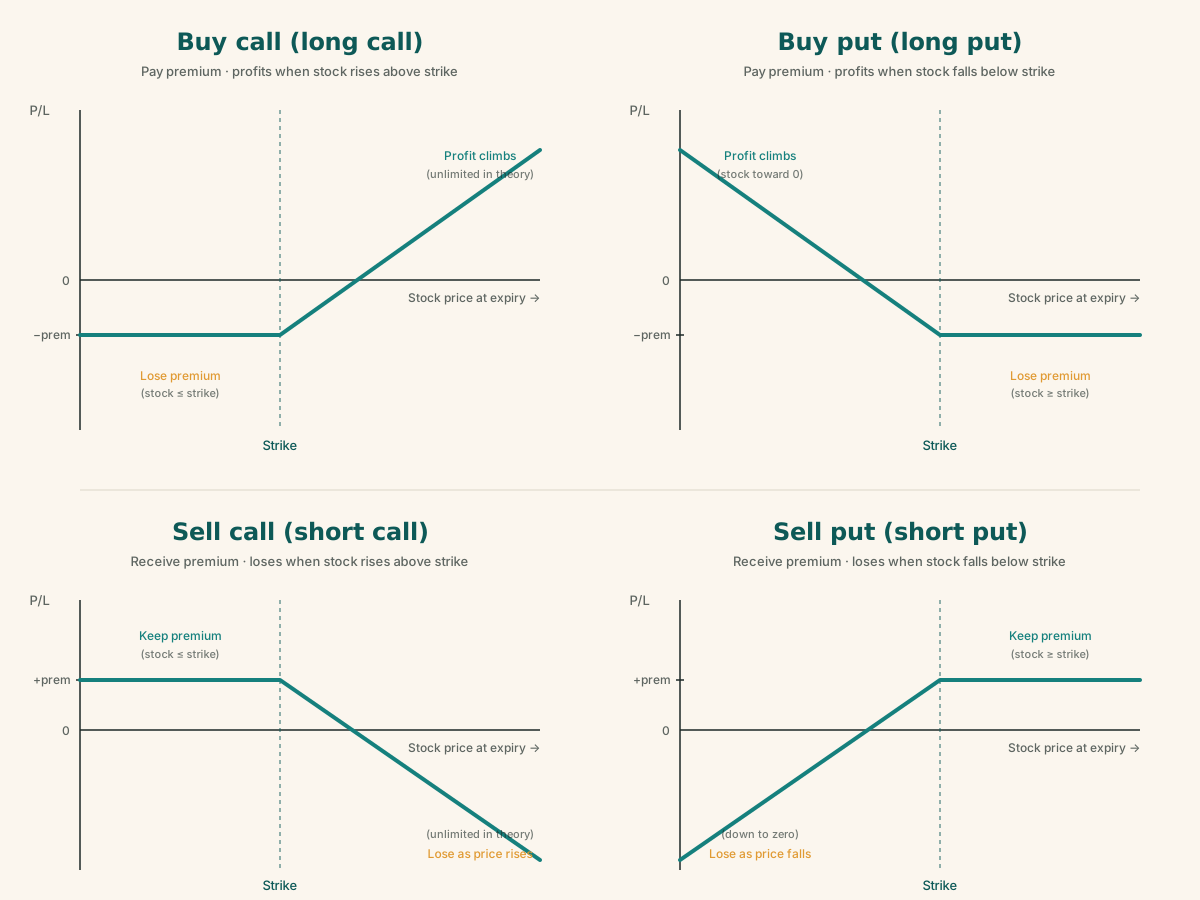
Read each one the same way:
- Buy call. You start out down the premium. Above the strike, profit grows one-for-one with the stock. Loss is capped at the premium paid.
- Buy put. Mirror of the call. You start out down the premium. Below the strike, profit grows as the stock falls. Loss is capped at the premium paid.
- Sell call. Flat profit of +premium up to the strike, then losses scale up with the stock. Profit is capped at premium received; loss is unbounded in theory.
- Sell put. Flat profit of +premium down to the strike, then losses grow as the stock falls. Profit is capped at premium received; loss runs almost to zero (the stock can crash to $0).
The zero-sum mirror
The first two diagrams (buying) are mirror images of the last two (selling). That isn't a coincidence — it's the fundamental accounting identity of options trading: whenever the buyer makes $X, the seller loses $X, and vice versa. Every options trade is a zero-sum transfer between the two sides.
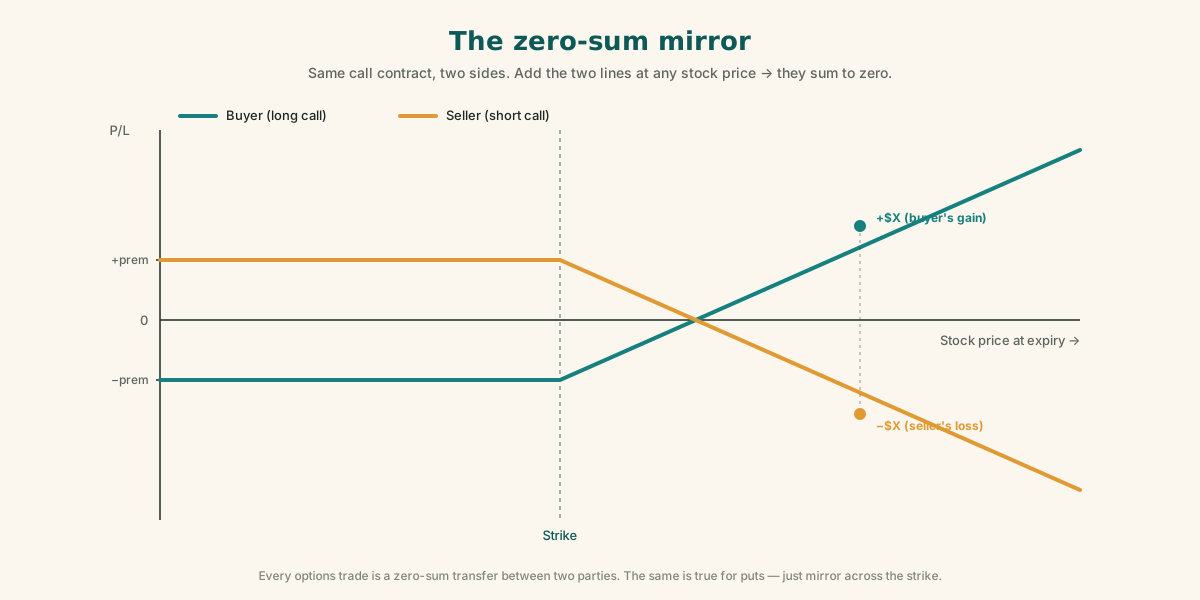
If you ever forget which way a position pays, sketch the other side's payoff and flip it across the horizontal axis. The two together always sum to zero (ignoring the brokerage's tiny cut).
Why people buy options
- Speculation. Profit from a directional view using much less capital than buying the stock outright. A small premium controls a large notional position.
- Hedging. Protect existing holdings against adverse moves. A put on a stock you own works like insurance against a crash.
- Defined risk. The most you can lose is the premium — useful for high-conviction directional bets with a strict downside.
Why people sell options
- Income. Collect premium consistently from options that expire worthless. Sellers are paid for taking on risk, like an insurance company.
- Acquire stocks at a discount. Selling a put pays you to wait at a price below the current market. If assigned, you own a stock you wanted at a planned price.
- Enhance returns on existing holdings. Sell calls against shares you already own to generate yield while you hold them.
- Neutral / range-bound strategies. When you expect the stock to drift sideways, sellers profit without needing a directional move.
The risks of selling options
Selling options is not free money. The premium you collect is small and capped; the loss you can take is large and, for short calls, theoretically unbounded. The risks worth naming explicitly:
- Asymmetric payoff. You earn small, capped premiums but risk much larger losses if the move goes against you. A few bad trades can erase many good ones.
- Sell call — potentially unlimited loss. A stock that gaps up sharply on news can produce a catastrophic loss for a call seller who does not own the underlying shares.
- Sell put — very large potential loss. If the stock crashes, the seller is on the hook for buying it at a strike well above the market.
- Capital required. Selling options ties up capital your broker holds as collateral. Margin calls during big moves can force you out at the worst possible time.
Best practices
These won't make you a profitable trader. They will keep you out of the dumbest mistakes.
- Always use limit orders when entering or exiting an option position. Market orders on options can fill at poor prices because spreads can be wide.
- Check the lot size first. Confirm exactly how many shares your contract represents before you trade.
- Size positions so a single bad trade can't blow up your account. Sellers in particular should treat tail losses as inevitable over time.
- Define your exit before you enter. A pre-planned profit target and loss limit removes emotion at decision time.
- Avoid holding short options through earnings unless you specifically want that exposure. Earnings can produce gaps that wipe out months of premium collection.
Worked examples
Same stock, same setups, with every outcome spelled out. Read across each row to confirm the formulas above.
Example 1 — buy call
Stock at $100. You buy a $110 call for $3 premium.
| Stock at expiry | Outcome | P/L |
|---|---|---|
| $100 | expires worthless | −$300 (premium paid) |
| $110 | expires worthless | −$300 |
| $120 | exercise / close | +$700 = (120 − 110 − 3) × 100 |
| $150 | big winner | +$3,700 |
Example 2 — buy put
Stock at $100. You buy a $90 put for $2 premium.
| Stock at expiry | Outcome | P/L |
|---|---|---|
| $100 | expires worthless | −$200 |
| $90 | expires worthless | −$200 |
| $80 | exercise / close | +$800 = (90 − 80 − 2) × 100 |
Example 3 — sell call
Stock at $100. You sell a $110 call for $5.
| Stock at expiry | Outcome | P/L |
|---|---|---|
| $100 | expires worthless | +$500 |
| $110 | expires worthless | +$500 |
| $120 | assigned at $110 | −$500 = (110 − 120) × 100 + 500 |
| $150 | assigned at $110 | −$3,500 |
Example 4 — sell put
Stock at $100. You sell a $90 put for $4.
| Stock at expiry | Outcome | P/L |
|---|---|---|
| $100 | expires worthless | +$400 |
| $90 | expires worthless | +$400 |
| $80 | assigned at $90 | −$600 = (80 − 90) × 100 + 400 |
| $70 | assigned at $90 | −$1,600 |
Notice the mirror in action: Example 1 and Example 3 are the same contract from opposite sides. When the buyer makes $700, the seller loses $700.
Quick comparison
| Feature | Buy call | Buy put | Sell call | Sell put |
|---|---|---|---|---|
| Market view | Bullish | Bearish | Neutral / slightly bearish | Neutral / slightly bullish |
| Right / obligation | Right to buy | Right to sell | Obligation to sell | Obligation to buy |
| Premium | Pay | Pay | Receive | Receive |
| Max profit | Unlimited | Large | Premium received | Premium received |
| Max loss | Premium paid | Premium paid | Unlimited | Large (stock to zero) |
| Best outcome | Stock rises sharply | Stock falls sharply | Stock stays at or below strike | Stock stays at or above strike |
Golden rules
Buying options
- Buy call → you expect the stock to rise.
- Buy put → you expect the stock to fall.
- Maximum loss = premium paid. No exceptions.
Selling options
- Sell call → you profit if the stock stays at or below the strike.
- Sell put → you profit if the stock stays at or above the strike.
- Maximum profit = premium received. No exceptions.
- Selling options carries significantly higher risk than buying options.
Universal
- Multiply by lot size before getting impressed (or scared) by a quoted premium.
- The buyer's gain is the seller's loss, line for line. Every option is a zero-sum transfer between two parties.
Final takeaway
| Buying options | Selling options | |
|---|---|---|
| Risk | Limited (premium paid) | Larger (large or unlimited) |
| Reward | Unlimited or large | Limited (premium received) |
| Cash flow at entry | Pay premium | Receive premium |
| Position | Has rights | Has obligations |
| Wants the market to | Move sharply in the chosen direction | Stay still or drift gently |
| Suited for | Beginners; directional bets, hedging | Experienced traders with proper risk management |
Key takeaways
- Buyers have rights. Sellers have obligations. That single asymmetry generates every other property of options.
- Buyers risk only the premium paid; sellers earn only the premium received but accept much greater potential downside.
- Calls profit when the stock rises above the strike; puts profit when the stock falls below the strike. Strike is the centre of every option's story.
- There are only four positions — buy call, sell call, buy put, sell put. Every strategy you will ever read about is built from these four blocks.
- Buyers want big moves; sellers want stillness. If you don't have a strong directional view, you are either selling premium or you should not be in the trade.
- Always multiply by lot size. A $5 premium isn't $5 — it's $500 per contract. This is the single most common beginner mistake.
- Every options trade is zero-sum between the two sides. The buyer's gain is the seller's loss, dollar for dollar.
If this is the first piece you have read about options, the next natural step is to see what an actual income strategy built from these four positions looks like end-to-end. The Wheel — a foundations guide to selling options for income walks through the two short positions (cash-secured put and covered call) in much more detail, with worked numbers, the Greeks, and the honest downside.
And if you got here cold and the patient-saver side of investing is more your speed, try the Monte Carlo retirement calculator → to see what the long-arc compounding side of the same question looks like.
Related reading
The Wheel: a foundations guide to selling options for income
What calls and puts actually are, how the Wheel strategy generates income, and where premium selling really earns — a careful look at the math behind options income.
Technical analysis from first principles: a beginner's complete guide
A thousand patterns have a thousand names — and every one of them is a footnote to a single tug-of-war between buyers and sellers. Candlesticks, chart patterns, support and resistance, moving averages, Bollinger Bands, MACD, and multi-time-frame analysis, explained from the ground up.
The bucket strategy for retirement: a simple guide with a $1.5M example
Keep a few years of expenses in safe, boring investments and the rest in stock index funds — so a market crash never forces you to sell at the bottom to pay your bills. Explained with a $1.5M, $5,000/month worked example.