
Options trading · Chapter 2 of 2
Selling covered calls
How to get paid for shares you already own — what a covered call is, the three outcomes, the honest disadvantages, and two complete approaches with the rules that go with each.
34 min read
In this chapter
- What a covered call actually is, and the three outcomes
- The advantages — and the honest list of disadvantages
- Placing the order without the two expensive mistakes
- Delta, theta, gamma — and the IV Rank trap
- Choosing days to expiry
- Two complete approaches — chart-driven and mechanical
- Earnings, rolling, and managing the position
- Results from a real book, and the checklists
What this chapter is for
This is a chapter for people who already own shares and want those shares to pay them something while they sit there. It assumes you know what a call option is. If that is new, read Chapter 1 first — it covers calls, puts, strike, expiry and premium from the ground up.
The aim here is narrower and more practical: what a covered call does, what it costs you, how to place one without making the two mistakes that cost real money, and two complete sets of rules you could actually follow.
Important: Options involve substantial risk and are not suitable for every investor. This material is for education only and is not individualized investment, tax or legal advice. Examples are simplified and, unless stated, exclude commissions, taxes and the bid/ask spread.
1. What a covered call actually is
The one-sentence version
You own 100 shares. You sell someone the right to buy them from you at a fixed price, before a fixed date. They pay you cash today for that right.
That cash is yours the moment the trade fills. It never comes back. The only open question is what happens to the shares.
The two pieces
"Covered" means you already own the shares. You are not promising something you do not have. This is what separates it from a naked call, which has unlimited risk and which no beginner should ever sell.
"Call" means the buyer gets the right to call the stock away from you at the agreed price.
One contract covers 100 shares. Always. If you own 240 shares you can sell two contracts, not 2.4.
A complete trade, start to finish
Own:        100 shares of GOOGL
Stock at:   $344.98
Sell:       1 contract, $370 strike, expiring in 30 days
Receive:    $425 cash, immediately
Three things are now true:
- $425 is in the account. Permanently. Nothing can take it back.
- If GOOGL goes above $370 by expiry, the shares are sold at $370 — even if the stock is at $400.
- If GOOGL stays below $370, nothing happens. The contract expires. You keep the shares and the $425.
What happened in this case: the stock drifted sideways, the contract lost value, and the position was bought back eight days later for $202. Net +$223, shares never at risk.
The language you will hear
| Term | Means |
|---|---|
| Strike | The agreed sale price ($370 above) |
| Premium | The cash you receive ($425) |
| Expiry / expiration | The deadline |
| DTE | Days to expiration |
| Assigned / called away | The buyer exercised; your shares were sold |
| Out of the money (OTM) | Strike is above the current price — the safe zone |
| In the money (ITM) | Strike is below the current price — assignment likely |
| Premium ÷ strike | Your yield on the trade. $425 ÷ $370 = 1.15% |
2. The three outcomes
There are only three. Know all three before you sell anything.
Outcome 1 — The stock stays below the strike (most common)
The contract expires worthless. You keep the premium and the shares. This is the win.
Roughly 70–80% of the time, if you choose strikes sensibly. Section 6 shows exactly how you control that number.
Outcome 2 — The stock rises above the strike
Your shares are sold at the strike. You keep the premium plus any gain up to the strike — but nothing above it.
Example: a PLTR $195 call sold for $315. PLTR then ran to $209. The $1,400 of gain above $195 belonged to the buyer, not the seller.
This is not a loss. You made money. You just made less than holding would have. Whether that stings depends entirely on your temperament — which is why section 4 matters more than any other part of this chapter.
Outcome 3 — The stock falls
The call expires worthless and you keep the premium. But you still own all of the decline.
If the stock drops $2,000 and you collected $400, you are down $1,600. The premium softened the fall; it did not stop it.
The single most important sentence in this chapter: a covered call reduces your downside by exactly the premium you collected, and not one cent more.
The payoff, in one picture
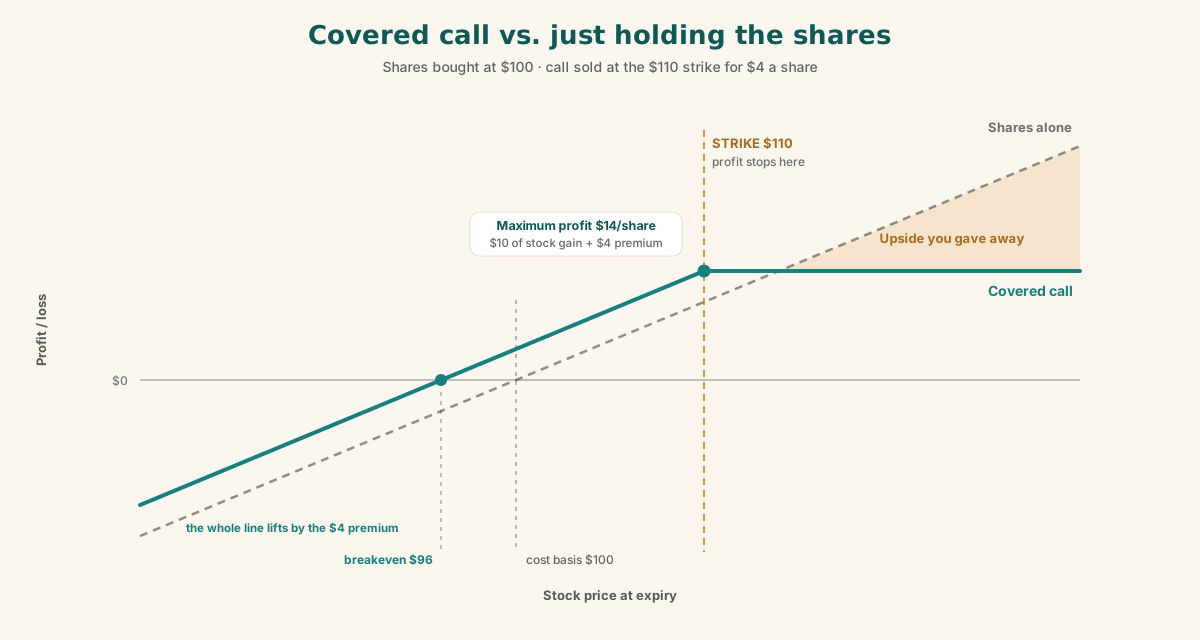
Your profit stops rising at the strike. Your loss keeps growing all the way down. That asymmetry is the entire trade-off, and everything else in this chapter follows from it.
3. Advantages
1 · Income from shares you already own. Idle stock produces nothing but dividends. Covered calls turn a static holding into a monthly cash flow. A book of roughly $200,000 in large-cap shares, written conservatively, can target about $500/month; written more aggressively, the same book produced $2,354 in four months.
2 · It lowers your effective cost basis, permanently. Every premium collected reduces what you effectively paid. Collect $400 a month for a year on a $25,000 position and your basis has fallen by $4,800 — nearly 20% — regardless of what the stock did.
3 · It makes money when nothing happens. Buy-and-hold needs the stock to rise. A covered call pays in three of four scenarios: up a little, flat, and down a little. Only a sharp rally costs you anything, and even then you keep a profit. In a sideways market this is the difference between a year of nothing and a year of income.
4 · The odds are knowable in advance. Unlike most of investing, you can read the probability off the screen before you commit. A 0.25 delta call has roughly a 25% chance of being assigned. You are not guessing.
5 · It is mechanical, and mechanical survives emotion. Clear entry rules, a clear profit target, a clear exit. In the record discussed in section 11, the average position was held 11 days and closed at a preset target — not on a feeling.
6 · Low capital requirement. If you already own the shares, the trade costs nothing to put on. No margin, no new capital, no borrowing. The premium arrives before anything else happens.
4. Disadvantages — the honest list
Spend more time here than anywhere else. Almost everyone who quits covered calls quits because of something here that nobody warned them about.
1 · Capped upside — and it will happen to you. This is the real cost. You sell the right tail of the distribution. Most of the time that tail is worth nothing. Occasionally it is worth a great deal.
A $195 PLTR call sold for $315 with the stock at $172.56. Three weeks later the stock was $198.78, then $209.
Collected: $315. Given up: roughly $1,400 of upside. Cost to buy the call back and keep the shares: $725.
You cannot avoid this. You can only choose how often you accept it, by choosing strike distance — which is what section 8 is about.
2 · You still own the entire downside. The premium is a thin cushion, not a hedge. A $400 premium against a $25,000 position protects you for 1.6%. The stock can fall 30% and the call does nothing about it.
If you are not comfortable owning the stock through a bad year, selling calls against it does not fix that. Sell the stock instead.
3 · The tax problem on long-held shares. Underappreciated, and often the largest cost of all. If you hold shares bought years ago at a low price, being assigned is a forced sale that triggers the full capital gain.
Worked example: 300 shares of NVDA, cost basis $108.51, stock at $230. One contract called away at a $250 strike realizes a $14,149 gain → roughly $2,122 in tax at a 15% long-term rate. The call that created it collected $93.
You accepted a $2,122 liability to earn $93.
The rule this produces: write calls against your highest-cost shares, not your lowest. This is the opposite of what most people do, because low-basis shares are usually the ones they are most eager to "do something with."
4 · The shares are locked. While a call is open, those 100 shares are committed. If you need to sell for any reason — rebalancing, a better opportunity, cash — you must buy the call back first, possibly at a loss.
5 · Assignment risk around dividends. If a call is in the money just before a stock goes ex-dividend, the buyer may exercise early to capture the dividend. You lose the shares and the dividend, often weeks before you expected to. Check the ex-dividend date before every trade on a dividend-paying stock.
6 · The psychological trap. This breaks more people than the math does. You sell a call, the stock rockets, and you watch your shares get taken at a price that now looks absurd. The temptation is to stop following the rules — to roll at any cost, to refuse to sell calls again, or to chase by selling closer to the money.
The premium is small and certain. The missed upside is occasional and large. If you cannot live with that shape, this strategy is not for you — and that is a perfectly legitimate conclusion to reach.
7 · Transaction costs and spreads. Roughly $0.65 per contract per side, plus the bid-ask spread. On a $50 premium, a $0.10 spread is a 20% haircut. On far-out-of-the-money contracts this matters enormously.
Rule: if the bid-ask spread exceeds about 10% of the mid price, skip that strike.
5. Placing the order
Before you place anything
- Do I own at least 100 shares? One contract per 100, no exceptions.
- Is the strike above my cost basis? Never write a call that forces a sale at a loss.
- Do I have options approval? Covered calls are the lowest tier, usually Level 1.
- Is there an earnings report before expiry? See section 9.
- Is there an ex-dividend date before expiry?
The steps
Platform menus differ, but the sequence is the same everywhere.
- Open the option chain. Enter the ticker; the chain appears below the quote.
- Pick the expiration. Each row expands to show one expiry. The number in brackets is days to expiry —
20 NOV 26 (38). Prefer the monthly (third Friday) over the weeklies. - Find your strike on the calls side — usually the left half of the chain. Use the delta column to choose it (section 6).
- Sell a single contract. Right-click the strike → Sell → Single, or your platform's equivalent. The order loads into the ticket.
- Check the ticket reads exactly:
SELL -1 TICKER 20 NOV 26 <strike> CALL @<price> LMT DAY - Set a limit price. Never a market order. Start at the mid between bid and ask. If it does not fill in 5–10 minutes, walk down in $0.05 steps toward the bid.
- Confirm and send. Read the confirmation screen before clicking.
The ticket, field by field
| Field | Must be | Why |
|---|---|---|
| SELL −1 | Negative quantity | Positive means you are buying a call |
| CALL | Not PUT | Easy to misclick; the chain shows both |
| Expiry | Your chosen date | Weeklies and monthlies sit adjacent |
| LIMIT | Never market | Option spreads are wide; market orders fill badly |
| DAY | Not GTC | A stale resting order can fill days later at a bad price |
| Position effect | TO OPEN | See below |
The position-effect trap
Most platforms default this field to AUTO. It usually guesses right. It does not always.
What this looks like in practice: a spread was closed at 12:23. Eighty-two minutes later an identical-looking ticket was sent. Because the position was now flat, AUTO resolved to TO OPEN — and opened the opposite position instead of closing anything. The error cost about $100 and took two days to notice.
Every single time, read the confirmation screen. It will say [TO OPEN] or [TO CLOSE]. Those two words are the difference between exiting a trade and doubling into its mirror image.
Immediately after the fill, place the exit
Do not wait. Place a good-till-cancelled buy-to-close order the moment you are filled, at your profit target.
Sold at $4.20  →  50% target  →  BUY +1 @2.10 LMT GTC
Sold at $0.93  →  80% target  →  BUY +1 @0.19 LMT GTC
Two reasons this matters more than it looks:
- It removes the decision. You will not be at your screen on the day the target hits.
- It stops good trades becoming bad ones. One position in the sample record reached +23%, was not closed, and round-tripped to breakeven within four days.
6. The Greeks that matter
Four Greeks exist. For this strategy, one does almost all the work.
Delta — the only one you choose deliberately
For a call seller, delta has two readings, and the second is why it matters:
- How much the option price moves per $1 of stock movement.
- Roughly the probability the option finishes in the money — that is, your chance of assignment.
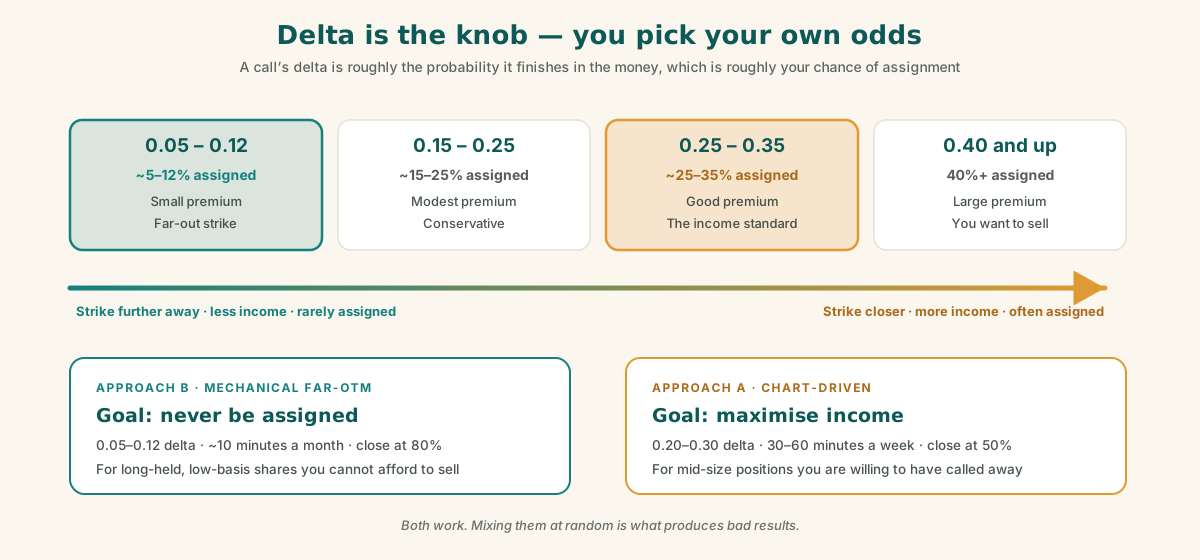
0.25 delta ≈ 25% chance of being assigned. 0.08 delta ≈ 8% chance.
That single approximation is the control knob of the entire strategy. You are not guessing at your odds; you are picking them off a screen.
| Delta | Assignment odds | Premium | Suits |
|---|---|---|---|
| 0.40+ | High | Large | Aggressive; you want to sell the shares |
| 0.25–0.35 | Moderate | Good | Income focus — the standard choice |
| 0.15–0.25 | Low | Modest | Conservative |
| 0.05–0.12 | Very low | Small | Protecting a position you must not lose |
The closed trades in section 11 averaged 0.26 delta at entry — squarely in the income band.
Theta — your income engine
Theta is what you earn per day for holding the position. A theta of −0.15 on a short call means roughly $15/day flowing to you, across the 100 shares the contract covers. The sign is negative from the buyer's point of view, which is why it reads as a minus.
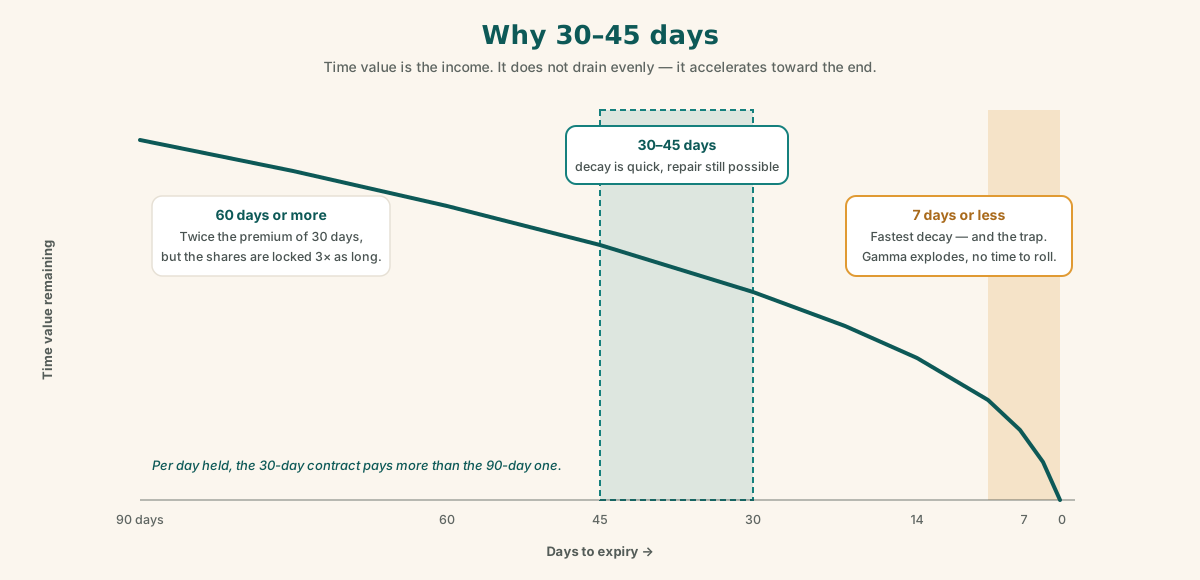
Theta accelerates as expiry approaches, which is the whole reason the 30–45 day window exists. Section 7 covers that.
Vega — why implied volatility matters
Vega measures sensitivity to implied volatility. As a seller you are short vega: you profit when implied volatility falls. The practical consequence is to sell when options are expensive rather than cheap — but see the warning below, because this is where most people over-think the problem.
Gamma — the one that bites
Gamma measures how fast delta changes. It explodes near expiry and near the strike.
A 0.10 delta call with 45 days left is stable. The same 0.10 delta with 3 days left can become a 0.60 delta on a single piece of news, with no time to react. This is the real argument against weekly options, and section 7 makes the case in full.
The IV Rank mistake
IV Rank tells you whether today's implied volatility is high or low for that stock's own past year. The common advice is "only sell when IV Rank is above 50."
That advice cost the sample account four weeks of trades. A hard IV-Rank gate was imposed, nothing cleared it, and no trades were made at all.
Here is what the actual record showed:
| Trade | IV Rank at entry | Result |
|---|---|---|
| AMZN $255 call | 54 — the highest | +$1.34 — the worst trade in the book |
| GOOGL $370 call | 15 — the lowest | +$223 — a solid winner |
IV Rank did not predict profitability.
The correct rule: IV Rank tells you which chain to look at. It never decides whether a trade is good. Measure the actual premium on the actual quote, and judge that.
A workable test: does the premium clear a minimum percentage of the strike? Something like 1% for 30–45 days is a reasonable floor for income-focused selling.
7. How many days to expiry
The standard answer: 30–45 days
This is not arbitrary.
Why not longer?
Theta — your daily income — is not linear. An option loses value slowly at first and rapidly near the end. A 90-day call pays perhaps twice what a 30-day call pays, but ties up your shares three times as long. Per day, the 30-day option pays more.
Why not shorter?
This is the subtle part, and where most people get it wrong.
At the same delta, a shorter-dated option genuinely does pay more per day. Real figures from one chain:
| DTE | Strike | Delta | Premium | Per day |
|---|---|---|---|---|
| 24 | 265 | 0.09 | $0.67 | $0.0279 |
| 45 | 285 | 0.08 | $0.93 | $0.0207 |
The short one pays 35% more per day. So why avoid it?
Because delta understates risk at short expiries. Look where those two strikes actually sit relative to the stock:
| DTE | Strike | Distance from the stock |
|---|---|---|
| 24 | 265 | 11.8% away |
| 45 | 285 | 19.3% away |
Identical risk by the delta number. Wildly different in reality. Delta is calculated from smooth, continuous price movement — it does not model overnight gaps.
Put an 8% gap through both:
| Starting delta | After the gap | |
|---|---|---|
| 24 DTE | 0.09 | 0.40 — emergency |
| 45 DTE | 0.08 | 0.23 — still comfortable |
At 7 days a breach is terminal. At 45 days it is repairable. Rolling a 30-day call up and out is usually free. Rolling a 3-day call costs real money, because there is no time value left to sell.
Never estimate a premium by scaling from another expiry
It seems reasonable — "half the days, so roughly 70% of the premium" — and it is badly wrong for out-of-the-money strikes.
A real miss: a 255 strike was estimated at $4.10 by scaling from a longer expiry. The actual quote was $1.88 — off by 2.2×.
The reason: premium depends on how far the strike sits in standard deviations, and that distance grows as time shrinks. The same strike that was comfortably inside the expected range at 45 days sits at its very edge at 24 days. Always pull the real chain.
Summary
| DTE | Verdict |
|---|---|
| 7 or less | Avoid. Gamma risk, no repair time, worst spreads |
| 14–21 | Acceptable only to dodge an earnings date |
| 30–45 | The standard. Use this. |
| 60+ | Shares locked too long for the extra income |
Also prefer monthly expiries over weeklies. Monthlies have far more volume, which means tighter spreads. On an out-of-the-money contract the weekly spread can exceed the entire premium.
8. Two complete approaches
Both of these work. They suit different people and different portfolios, and mixing them at random is what produces bad results.
Approach A — Chart-driven
Write only when conditions favour you. Skip the rest.
Not every month is a good month to sell a call. A stock in a powerful uptrend will blow through your strike. A stock going nowhere will let the option expire worthless. Read the condition first, then decide.
1 · The long-term trend (weekly MACD)
| Reading | Meaning for a call seller |
|---|---|
| Above zero but falling | Best case. Uptrend intact but losing steam |
| Above zero and rising | Worst case. Momentum accelerating against you |
| Below zero | Stop. This is a question about whether to own the stock at all |
2 · Resistance — where to put the strike. Find the level the stock has repeatedly failed to break: a previous high, a round number, a prior peak. Place the strike at or above it, never just below it. A strike sitting under a known ceiling is the worst placement available — price stalls there and you own the risk without the distance. (Technical analysis from first principles covers how to identify these levels.)
3 · Trend strength (ADX and DI)
| Reading | Meaning |
|---|---|
| ADX below 20 | No trend. The ideal condition |
| ADX above 25 with buyers leading | The enemy. A confirmed uptrend will carry price through your strike |
| ADX above 40 with buyers leading | Absolute refusal. Do not write |
4 · The premium, measured on the actual quote. Does it clear your floor — something like 1% of strike for a 30–45 day contract?
The rules that go with it
| Delta | 0.20 – 0.30 |
| DTE | 30 – 45 |
| Strike | Above cost basis, above resistance |
| Premium floor | ≥ 1% of strike |
| Exit | Buy to close at 50% of max profit, GTC placed immediately |
| Skip when | Strong uptrend, earnings inside expiry, premium below floor |
Honest assessment
Strengths — higher income per trade; you avoid the worst setups; you learn the market.
Weaknesses — it takes 30–60 minutes a week, it requires reading charts correctly, and you will sit out whole months. In one recent month this approach produced no new trades at all across five large-cap names, because earnings dates blocked every usable expiry. That is the system working, and it is still frustrating.
Suits: engaged traders, moderate position sizes, people who enjoy the analysis.
Approach B — Mechanical far-out-of-the-money
The same thing every month. Small, consistent, almost never assigned.
Flip the objective. You are not maximising income — you are renting out a tail you believe will never be exercised, for a small fee, forever.
This is the right approach when assignment is the thing you most want to avoid: long-held shares with large embedded gains, a position you intend to keep for a decade, or stock where a forced sale triggers a serious tax bill.
The rules
| Delta | 0.05 – 0.12 |
| Minimum distance | 1.5 × the expected move shown on the chain |
| DTE | 30 – 45 |
| Premium floor | None as a percentage — see below |
| Target | A fixed monthly dollar amount across the whole portfolio |
| Exit | Buy to close at 80% of max profit |
| Skip only when | A strong confirmed uptrend, or earnings inside the expiry |
Why there is no percentage floor
A 1%-of-strike floor is incompatible with 0.08 delta. A far-out-of-the-money call pays perhaps 0.25% of strike. Applying an income-selling floor here would block every single trade.
Replace it with a monthly dollar target. Decide you want, say, $500/month from the whole book. Then each cycle, start at the furthest-out strikes and work inward across your holdings until the target is met — and stop.
Strike distance becomes an output, not an input. Some months you will sell very far out. In low-volatility months you will have to come closer. If you cannot reach the target without breaking your delta ceiling, take the shortfall. A $300 month is a correct outcome. Reaching for income is how assignment happens.
Defending the position
Because assignment is the loss here, you need a repair plan and a budget for it.
| Trigger | Action |
|---|---|
| Delta reaches 0.30 | Amber. Price the roll, take no action |
| Delta reaches 0.45 | Act today. Roll up and out |
| Strike touched, or ≤5 days left while in the money | Mandatory, same session |
And — unusually — you are allowed to pay to escape. In income selling you only roll for a credit. Here, paying a debit to avoid assignment is often correct, because the tax bill dwarfs the cost.
Budget it: something like the greater of (3× the premium collected) or (20% of the tax that assignment would trigger). If escape costs more than that, close the call at a loss anyway and keep the shares. Losing $600 on a call to avoid a $2,400 tax event is a good trade, not a bad one.
What it looks like in practice
On a roughly $200,000 book of five large-cap names:
| Monthly target | $500 |
| As an annual yield | ~3% |
| Contracts open | 2–6 |
| Time required | ~10 minutes a month |
| Expected assignments | Roughly 1 in 12 |
Honest assessment
Strengths — almost no time; almost never assigned; emotionally easy, because you rarely watch upside walk away; it works on positions you cannot afford to sell.
Weaknesses — the income is genuinely small; you will still occasionally be breached; and because the premium is tiny, commissions and spreads eat a larger share of it.
Suits: large long-held portfolios, low cost basis, tax-sensitive holders, busy people.
Side by side
| A · Chart-driven | B · Mechanical far-OTM | |
|---|---|---|
| Objective | Maximise income | Never be assigned |
| Delta | 0.20 – 0.30 | 0.05 – 0.12 |
| Assignment odds | 20–30% per trade | 5–12% |
| Premium per contract | $237 – $1,444 | $50 – $100 |
| Profit target | 50% | 80% |
| Pay a debit to escape? | No | Yes, within budget |
| Charts needed | Four checks every trade | One check (avoid strong uptrends) |
| Time | 30–60 min/week | ~10 min/month |
| Decisions per year | ~50 | ~12 |
| Months with no trade | Common | Rare |
| Best for | Active, mid-size positions | Large, low-basis, long-held |
Can you skip charts entirely?
Almost. A pure mechanical version — write 0.08 delta at 35 days on a fixed schedule, no chart at all — is viable, and many people run it.
But keep one check. The single most dangerous condition for a call seller is a strong, confirmed uptrend. That is the one state that reliably carries price through even a distant strike. If you look at exactly one thing before each trade, look at ADX and DI: above 25 with buyers leading, skip that name this month.
That is a 15-second check, and it removes most of the trades you would regret.
9. Earnings
Why earnings gets its own section
Every risk control you have assumes continuous prices. You watch delta rise, you roll, you close.
An earnings gap deletes all of that. The stock closes at $15.23 and opens at $13.70. There was never a moment at $14.50 where you could act. It did not travel there — it teleported.
Earnings does not make the risk bigger. It removes your ability to manage it.
The honest counter-argument
Implied volatility rises into a report and collapses afterwards. As a seller you are paid for that uncertainty, and then it evaporates in your favour.
This is why many professionals deliberately sell into earnings. It is not foolish — stocks move less than the implied move roughly 60–70% of the time, so the win rate is genuinely high.
So why avoid it?
Because of the shape, not the average.
A real position: 10 contracts against 1,000 shares, $670 collected, stock at $15.23 with 58% implied volatility, earnings in two weeks.
| Stock on the open | Position P/L |
|---|---|
| +10% | +$510 |
| Flat | +$80 |
| −10% | −$940 |
| −15% | −$1,730 |
Best realistic case +$510. Bad case −$940 to −$1,730. You win often and small; you lose rarely and large.
The expected value is roughly zero — markets price it fairly. What is not neutral is the variance. A fund running this across 200 names collects the edge and ignores the tails. You have one position.
The bar-count trap
Most platforms show an "earnings in N days" label. On a daily chart, N counts trading days, not calendar days.
18 bars ≈ 18 trading days ≈ 25 calendar days
Mistaking one for the other will put you through a report you thought you had cleared. Always convert, and verify against the calendar.
The earnings rules
- No short call held through an earnings report. Simple, absolute, easy to follow.
- When no expiry in your 30–45 day window is clear, you may use a shorter one — down to about 21 days — provided it expires before the report and you reduce delta to compensate for the shorter repair window.
- If clearing earnings needs fewer than about 21 days, do not trade that name this cycle. Take the shortfall.
- The best window is right after a report. Volatility is crushed so you collect less — but the binary event is gone and the next one is a full quarter away.
A reality check: across five large-cap holdings in one recent month, every single one reported within a three-week span. Every 30–45 day expiry contained a print. The entire month was a blackout.
The calendar gives you roughly three clean weeks in every thirteen. Plan around that rather than being surprised by it.
10. Managing the position
Take profits early
Buy the call back at a preset percentage of maximum profit. You give up the last slice; you gain speed, certainty, and the ability to redeploy.
| Approach | Target | Rationale |
|---|---|---|
| Income selling | 50% | Captures most of the decay, frees the shares early |
| Far-OTM selling | 80% | At 0.08 delta the last 20% decays almost free |
Evidence this works: 10 closed trades, average hold 11 days on 30–45 day contracts, 45% of premium captured. Positions were closed in roughly a third of their nominal life.
Rolling — and the trade that proves it
Rolling means buying back the current call and selling a new one, further out in time and usually higher in strike.
A roll, step by step
Day 1 Sold 2 × NVDA $235 calls for $504 NVDA rallied. The calls went against the position Day 7 Bought back for $1,374 → realized −$870 Day 7 Rolled: sold 2 × $240 calls for $1,444 (a net credit of $0.35) Day 13 Bought back for $240 → realized +$1,204 Net across the sequence: +$334 Read that −$870 line carefully. In isolation it looks like the worst trade in the book. It was one leg of a sequence that finished profitably, kept the shares, and took six days.
Two rules that make rolling work:
- Roll for a net credit. If you cannot get one at a strike you would accept, take the assignment instead. (The exception is the far-OTM approach, where avoiding a tax event justifies a debit.)
- After a roll, your profit target is 50% of the cumulative net credit — not 50% of the new contract's price. Otherwise you lose track of what the position has actually earned.
When to let it go
Sometimes assignment is simply the right outcome. If the shares were bought to sell eventually and the strike is a price you are happy with, take it. You made your maximum profit. That is a success, not a failure.
Fighting every assignment is how a simple income strategy turns into an expensive one.
11. What a real book looks like
Four months, one account, large-cap US equities, chart-driven approach.
| # | Stock | Strike | Delta | IV Rank | Premium | Days | Result |
|---|---|---|---|---|---|---|---|
| 1 | NVDA ×2 | 225 | 0.30 | 43 | $848.65 | 30 | +$690.65 |
| 2 | AMZN | 255 | 0.25 | 54 | $241.34 | 13 | +$1.34 |
| 3 | GOOGL | 405 | 0.20 | 39 | $430 | 7 | +$346 |
| 4 | AMZN | 275 | 0.25 | 18 | $355 | 13 | +$230 |
| 5 | GOOGL | 365 | 0.24 | 19 | $390 | 13 | +$240 |
| 6 | NVDA ×2 | 235 | 0.21 | 21 | $504 | 6 | −$870 (rolled) |
| 7 | NVDA ×2 | 240 | 0.40 | 33 | $1,444 | 6 | +$1,204 |
| 8 | AMZN | 265 | 0.23 | 21 | $340 | 8 | +$170 |
| 9 | GOOGL | 370 | 0.24 | 15 | $425 | 8 | +$223 |
| 10 | AMZN | 262.5 | 0.27 | 30 | $237 | 6 | +$119 |
| Metric | Value |
|---|---|
| Premium sold | $5,214.99 |
| Realized | $2,353.99 |
| Capture rate | 45% |
| Average hold | 11 days |
| Average entry delta | 0.26 |
| Sequences finishing positive | 9 of 9 |
What this table is and is not. It is one account over four months in a rising market, shown to illustrate how the rules behave in practice. It is not a track record, not a projection, and not a basis for expecting similar results.
Five lessons from it
1 · IV Rank predicted nothing. The highest IV Rank trade (54) returned $1.34. The lowest (15) returned $223. Use it to decide which chain to open — never whether to trade.
2 · A losing leg is not a losing trade. That −$870 was part of a roll that finished +$334 in six days.
3 · Taking profits early is where the edge lives. Average hold of 11 days on 30–45 day contracts. Shares freed in a third of the nominal time means roughly three times as many cycles a year.
4 · The one that got away was the one in a strong uptrend. The PLTR $195 call was written while the stock trended powerfully upward with buyers decisively in control. It ran to $209. Cost to escape: $725 against $315 collected. Every other trade in this book was written into a flat or cooling chart.
5 · Be honest about the regime. Four months in a rising market. Nine of nine sequences positive is not a repeatable expectation — it reflects a benign period as much as a good process. A sharp, sustained rally would have produced several assignments and a very different-looking table.
12. Checklists
Before every trade
- I own 100+ shares per contract
- Strike is above my cost basis
- No earnings before expiry (converted from bars to calendar days)
- No ex-dividend before expiry
- 30–45 days to expiry
- Delta inside my chosen band
- Premium checked on the live quote, not estimated
- Bid-ask spread under ~10% of mid
- Strike at or above resistance
- Not a strong uptrend (ADX above 25 with buyers leading)
- I would be content if the shares were called away at this price
Sending the order
- SELL −1, not buy
- CALL, not put
- Correct expiry (monthly, not the adjacent weekly)
- LIMIT, starting at the mid
- DAY, not GTC
- Confirmation screen says TO OPEN
Immediately after the fill
- GTC buy-to-close placed at the profit target
- Logged: date, strike, expiry, premium, delta, and the reason
Each week
- Any position at 0.45 delta or beyond? Act today
- Any strike touched? Act today
- Any earnings date now inside an open position?
- Any profit target hit but not filled?
Formulas and glossary
The formulas
Yield on the trade        =  premium ÷ strike
Annualized                =  (premium ÷ strike) × (365 ÷ DTE)
Effective cost basis      =  original basis − all premiums collected
Breakeven on the shares   =  cost basis per share − premium per share
Max profit, in dollars    =  (strike − basis) × 100 + premium
Note the units: strike and basis are per share, while the premium you see in your account is the whole contract. A $425 premium on one contract is $4.25 per share, so shares bought at $100 break even at $95.75 — not at $100 − $425.
Maximum profit and "profit if called away" are the same number. A covered call's best case is assignment at the strike.
The 1% check, done in your head: move the strike's decimal point two places left. A $370 strike needs about $3.70. That is your floor for an income-focused 30–45 day call.
Glossary
| Term | Plain meaning |
|---|---|
| Assignment | Your shares were sold because the buyer exercised |
| ATM / ITM / OTM | At / in / out of the money relative to the strike |
| Delta | Price sensitivity — and roughly your odds of assignment |
| DTE | Days to expiration |
| Expected move | The range the option market implies by expiry |
| Extrinsic value | The time-and-volatility part of the premium |
| Gamma | How fast delta changes. Explodes near expiry |
| GTC | Good till cancelled — a resting order |
| Implied volatility (IV) | The market's forecast of future movement |
| IV Rank | Where today's IV sits in the stock's own past year |
| Intrinsic value | How far in the money the option is |
| Premium | The cash you receive |
| Roll | Close the current call, open a later one |
| Strike | The agreed sale price |
| Theta | Daily time decay — your income |
| Vega | Sensitivity to implied volatility |
The one thing to take away
A covered call is not a way to make money from stocks. It is a way to get paid for giving up the best outcomes.
Most of the time that is a trade worth making — the best outcomes are rare and the payments are regular. But you should make it knowingly, with a number attached, and with the rules written down before the market gives you a reason to break them.
You can check the numbers on any of this yourself. The options calculator handles a single covered call — breakeven, maximum profit, return if called away. The strategy builder will show you the same position as a payoff curve and a price-by-date grid, which is the fastest way to see the flat ceiling above the strike for yourself.
Go deeper
- The Wheel: a foundations guide to selling options for incomeWhat calls and puts actually are, how the Wheel strategy generates income, and where premium selling really earns — a careful look at the math behind options income.
- Calls and puts, explained: a beginner's guide to buying and selling optionsWhat calls and puts actually are, who's on each side of the trade, where the money flows, and the four positions that make up every options strategy — written for someone who has never traded an option before.
- Technical analysis from first principles: a beginner's complete guideA thousand patterns have a thousand names — and every one of them is a footnote to a single tug-of-war between buyers and sellers. Candlesticks, chart patterns, support and resistance, moving averages, Bollinger Bands, MACD, and multi-time-frame analysis, explained from the ground up.